Note
Go to the end to download the full example code.
Mass distribution#
This tutorial shows how to compute and fit mass distributions from a movie once a contrast-to-mass calibration is available:
Download an example movie.
Set a contrast-to-mass calibration.
Run detection + PSF fitting to obtain a table of event masses.
Fit peaks in the mass histogram and visualize the result.
Imports#
We first import necessary packages and modules.
Download example data#
This tutorial uses a short example movie from Zenodo. You can replace this block with a direct file path once you have a local movie.
from zenodozipdownloader import ZenodoZipDownloader

import massphoto as mp

files = ZenodoZipDownloader(
    doi="10.5281/zenodo.15800729",
    download_dir="example_data",
).download("Figure 2.zip/006_dynamin_6.mp")
if not files:
    raise RuntimeError(
        "Failed to download example data. Please download it manually from https://zenodo.org/record/15800729 "
        "or set path_movie to your own movie."
    )
path_movie = files[0]

print(f"Using movie: {path_movie}")
Using movie: /home/runner/work/massphoto/massphoto/docs/source/_examples/example_data/006_dynamin_6.mp
Analyse with default parameters#
Set mass calibration parameters. See the mass calibration example for how to obtain these from a calibration movie: Mass calibration.
# Disable progress bars for cleaner output in this tutorial
mp.defaults.set("progress_bar", False)

# Set contrast-to-mass calibration parameters (intercept, slope). Adjust to match your calibration.
mp.defaults.set("mass_calibration", (-5.2, 3.1e4))

# Run detection and fitting. Keep the ratiometric frames for inspecting events.
# Sequential execution limits peak memory while retaining those frames.
fitres, movie_r = mp.fit(path_movie, return_ratiometric=True, scheduler="synchronous")
fitres[["frame", "x", "y", "contrasts", "masses_kDa"]].head().round({"x": 2, "y": 2, "contrasts": 5, "masses_kDa": 1})
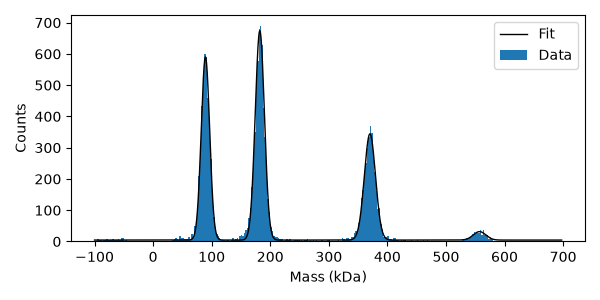
Fit mass distribution
histfit = mp.distfit.fit(fitres["masses_kDa"], bins=np.arange(-100, 700, 2.5), include_background=True)
histfit.peaks[["mu", "sigma", "A"]].round(2)
Plot results
plt.figure(figsize=(6, 3))
plt.bar(histfit.bin_centers, histfit.counts, width=histfit.bin_widths, edgecolor="none", label="Data")
plt.plot(histfit.model_x, histfit.model_y, color="black", lw=1, label="Fit")
plt.xlabel("Mass (kDa)")
plt.ylabel("Counts")
plt.legend()
plt.tight_layout()
Analyse with custom parameters#
# Read the movie
movie, metadata = mp.read_movie(path_movie, convert_metadata=True)


# Inspect the metadata
print("Metadata:")
pprint(metadata)

# Check default thresholds for detection
print("Default detection thresholds:", mp.defaults.get("event_correlation_step.thresholds"))

# We could adjust these if we want to be more or less sensitive, for all following analyses. For example:
# mp.defaults.set("event_correlation_step.thresholds", [0.5, 0.4, 0.001])

# Check default averaging window
print("Default navg:", mp.defaults.get("navg"))

# We could adjust the default like this:
# mp.defaults.set("navg", 5)


##
# We can also specify detection arguments here, which will only apply to this fit call.
fitres = mp.fit(
    movie,
    movie_correct_drift=True,
    ratiometric_args={
        "navg": 5,
    },
    detection_args={
        "thresholds": [
            0.5,  # temporal threshold
            0.4,  # spatial threshold
            0.001,  # contrast threshold
        ],
        # navg for the temporal filter (longer than navg for the ratiometric filter is often beneficial)
        "correlation_step_args": {"navg": 10},
    },
)

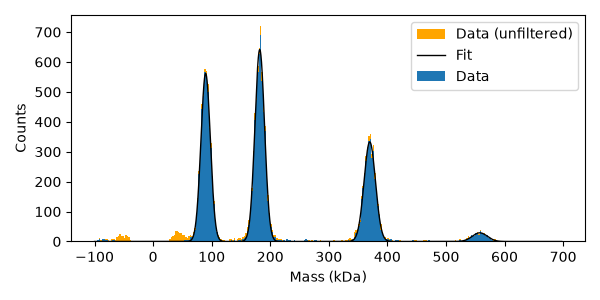
# We decreased the integration time and lowered the thresholds, which leads to more events being detected, but also more noise.
# To remove some of the noise, we can filter based on fit quality or mass uncertainty.
filter_str = "masses_kDa_se < 10 & r2_fit > 0.4"
histfit = mp.distfit.fit(
    fitres.query(filter_str),
    bins=np.arange(-100, 700, 2.5),
    initial_peaks=(90, 180, 360, 540),
    include_background=False,
)
histfit.peaks[["mu", "sigma", "A"]].round(2)
Metadata:
{'camera': 'GS3_U3_23S6M_C',
 'exposuretime': 7.646799087524414,
 'exposuretime_effective': 15.293598175048828,
 'exposuretime_unit': 'ms',
 'field_of_view': (11.7528, 16.4964),
 'field_of_view_unit': 'um',
 'framebinning': 2,
 'framerate': 128.20632934570312,
 'framerate_effective': 64.10316467285156,
 'framerate_unit': 'Hz',
 'image_shape': (166, 233),
 'instrument': 'Refeyn TwoMP',
 'pixelbinning': 6,
 'pixelsize': 0.0118,
 'pixelsize_effective': 0.0708,
 'pixelsize_unit': 'um'}
Default detection thresholds: (0.6, 0.5, 0.001)
Default navg: 10
Compare the unfiltered distribution, selected events, and fitted peaks.
plt.figure(figsize=(6, 3))
plt.hist(fitres["masses_kDa"], bins=histfit.bin_edges, edgecolor="none", facecolor="orange", label="Data (unfiltered)")
plt.bar(histfit.bin_centers, histfit.counts, width=histfit.bin_widths, edgecolor="none", label="Data")
plt.plot(histfit.model_x, histfit.model_y, color="black", lw=1, label="Fit")
plt.xlabel("Mass (kDa)")
plt.ylabel("Counts")
plt.legend()
plt.tight_layout()
Total running time of the script: (1 minutes 3.736 seconds)