Note
Go to the end to download the full example code.
Shot noise curve#
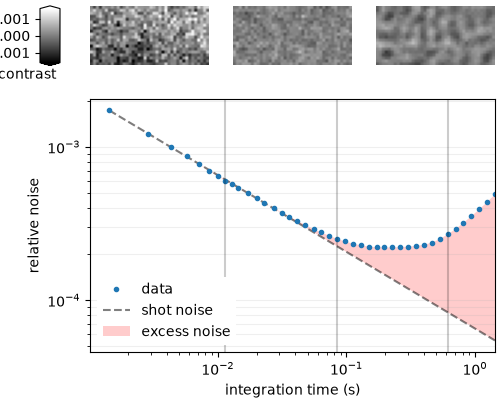
The shot noise curve is a practical tool for characterising the noise floor of a mass photometry measurement. It shows how the standard deviation of the ratiometric signal decreases as a function of the averaging window \(n_{avg}\).
In an ideal, shot-noise-limited measurement the standard deviation falls as \(1/\sqrt{n_{avg}}\). Any excess above this line indicates additional noise sources such as laser intensity fluctuations, mechanical vibrations, or sample drift.
This example computes the curve from scratch using massphoto.calc_ratiometric()
and plots it on log-log axes together with the shot noise reference and the
excess noise region.
Imports#
import matplotlib.pyplot as plt
import numpy as np

import massphoto as mp
Download example data#
We use a buffer (PBS) only measurement without protein landing events.
from zenodozipdownloader import ZenodoZipDownloader

files = ZenodoZipDownloader(
    doi="10.5281/zenodo.15800729",
    download_dir="example_data",
).download("Figure 4.zip/4a/PBS_4.mp")
if not files:
    raise RuntimeError(
        "Failed to download example data. Please download it manually from "
        "https://zenodo.org/record/15800729 or set path_movie to your own movie."
    )
path_movie = files[0]
print(f"Using movie: {path_movie}")
Using movie: /home/runner/work/massphoto/massphoto/docs/source/_examples/example_data/4a/PBS_4.mp
Read movie and extract frame rate#
massphoto.read_movie() returns the raw pixel data and a metadata dictionary.
Passing convert_metadata=True sets framerate_effective (frame
rate after any pre-binning), which we use to label the x-axis in seconds.
movie, metadata = mp.read_movie(path_movie, convert_metadata=True)
fps = metadata["framerate_effective"]

# Crop to a spatial sub-region and limit frames to speed up the example
movie = movie[:5000, 10:30, 80:120]

print(f"Movie shape: {movie.shape}  dtype: {movie.dtype}")
print(f"Effective frame rate: {fps:.1f} Hz")
Movie shape: (5000, 20, 40)  dtype: uint16
Effective frame rate: 699.0 Hz
Compute the shot noise curve#
For each averaging window size \(n_{avg}\) we:
Compute the full ratiometric movie with
massphoto.calc_ratiometric().Take the standard deviation of each valid frame over the spatial axes, then average across frames.
The averaging window sizes are generated with a log-spaced grid so that the curve is sampled evenly on the log-log plot. We cap \(n_{avg}\) at half the movie length to ensure there are always enough frames to compute the ratiometric signal.
navg_max = min(1000, movie.shape[0] // 2 - 1)
navgs = np.unique(np.logspace(0, np.log10(navg_max)).astype(int))

r_std_avg = np.zeros(navgs.size)

for idx, navg in enumerate(navgs):
    r = mp.calc_ratiometric(movie, navg, medfilt_kernel_size=0)
    r_std = np.std(r, axis=(1, 2))
    r_std = r_std[np.isfinite(r_std)]
    r_std_avg[idx] = np.mean(r_std)
Plot#
The top row shows ratiometric frame thumbnails at three example integration times so you can see how the image improves as \(n_{avg}\) grows. The bottom panel shows the shot noise curve: the dashed black line is the theoretical \(1/\sqrt{n_{avg}}\) shot noise limit anchored to the first data point, and the red region highlights excess noise above that floor.
# Three navg values spread across the range for the thumbnails
frames_navgs = navgs[[len(navgs) // 6, len(navgs) // 2, len(navgs) * 5 // 6]]
nframes = len(frames_navgs)
frame_idx = movie.shape[0] // 2

fig = plt.figure(figsize=(5, 4))
gs = fig.add_gridspec(nrows=2, ncols=nframes, height_ratios=[1, 4], left=0.18, right=0.99, bottom=0.12, top=0.99)

ax_fr = [fig.add_subplot(gs[0, 0])]
for i in range(1, nframes):
    ax_fr.append(fig.add_subplot(gs[0, i], sharex=ax_fr[0], sharey=ax_fr[0]))

ax_curve = fig.add_subplot(gs[1, :])

cmax = 0.0016
for ax, navg in zip(ax_fr, frames_navgs):
    start = max(frame_idx - navg - 1, 0)
    r0 = mp.calc_ratiometric(movie[start : frame_idx + navg + 2], navg, medfilt_kernel_size=0)
    im = ax.imshow(r0[r0.shape[0] // 2], cmap="gray", vmin=-cmax, vmax=cmax)
    ax.axis("off")
    ax.set_xlabel(f"{navg / fps:.2g} s", fontdict={"fontweight": "light"})

ax_pos = ax_fr[0].get_position().bounds
cbaxes = fig.add_axes((0.08, ax_pos[1], 0.04, ax_pos[3]))
plt.colorbar(im, cax=cbaxes, extend="both")
cbaxes.yaxis.set_ticks_position("left")
cbaxes.set_xlabel("contrast", loc="right")
cbaxes.xaxis.set_label_coords(0.8, -0.1)

t = navgs / fps  # convert averaging window from frames to seconds

ax_curve.fill_between(
    t,
    r_std_avg[0] / np.sqrt(navgs),
    r_std_avg,
    color="r",
    alpha=0.2,
    edgecolor="none",
    label="excess noise",
)
ax_curve.loglog(t, r_std_avg[0] / np.sqrt(navgs), "--k", alpha=0.5, label="shot noise")
ax_curve.loglog(t, r_std_avg, ".", label="data")

# Mark the thumbnail integration times on the curve
for navg in frames_navgs:
    ax_curve.axvline(navg / fps, color="k", alpha=0.2)

ax_curve.set_xlim(right=t[-1])
ax_curve.grid(axis="y", visible=True, which="both", alpha=0.2)
ax_curve.set_xlabel("integration time (s)")
ax_curve.set_ylabel("relative noise")

handles, labels = ax_curve.get_legend_handles_labels()
ax_curve.legend(
    reversed(handles), reversed(labels), loc="lower left", facecolor="white", edgecolor="none", framealpha=1
)

plt.tight_layout()
Total running time of the script: (0 minutes 15.198 seconds)