Note
Go to the end to download the full example code.
Movie properties over time#
This example demonstrates how to extract and inspect frame-level movie properties over time during movie processing:
Enable frame-level movie metrics calculation in
massphoto.fit().Access the per-frame metric time-series from
events.attrs["frame_metrics"].Annotate detected events with their local frame properties using
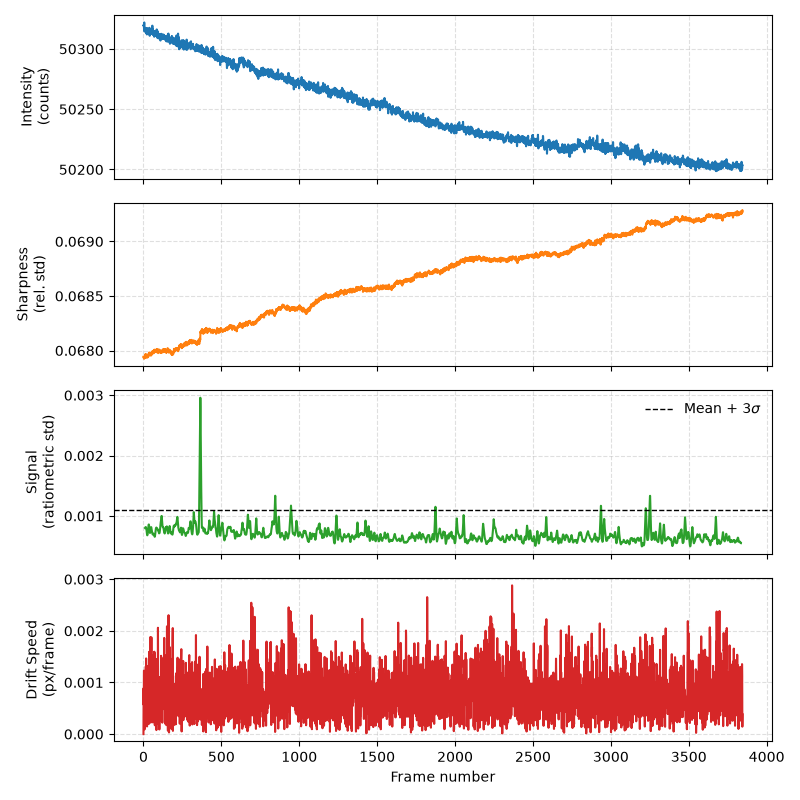
massphoto.events.annotate_frame_metrics().Plot the time-series of raw intensity, sharpness, ratiometric signal, and drift speed.
Use frame metrics to identify unstable movie segments and filter events.
Imports and Setup#
import matplotlib.pyplot as plt
from zenodozipdownloader import ZenodoZipDownloader

import massphoto as mp

# Download example movie from Zenodo
files = ZenodoZipDownloader(
    doi="10.5281/zenodo.15800729",
    download_dir="example_data",
).download("Figure 2.zip/006_dynamin_6.mp")
if not files:
    raise RuntimeError(
        "Failed to download example data. Please download it manually from https://zenodo.org/record/15800729 "
        "or set path_movie to your own movie."
    )
path_movie = files[0]
Process Movie with Movie Metrics#
When compute_movie_metrics=True is passed to massphoto.fit(), massphoto
calculates frame-level summary metrics alongside candidate detection:
intensity: mean raw camera counts per frame (detects illumination fluctuations or laser drift).sharpness: relative standard deviation of the raw frame after median-filter background subtraction (detects focus drift or dirt).signal: standard deviation of the ratiometric frame (noise floor and crowding).drift_speed: frame-to-frame displacement speed in pixels/frame (when drift correction is enabled).
mp.defaults.set("progress_bar", False)
mp.defaults.set("mass_calibration", (-5.2, 3.1e4))

fitres = mp.fit(
    path_movie,
    compute_movie_metrics=True,
    movie_correct_drift=True,
)

# The full frame-level time-series is stored in the DataFrame's attrs. Note that the DataFrame's attrs can get lost on copying or slicing. Therefore, it makes sense to make a copy when the metrics are required.
frame_metrics = fitres.attrs["frame_metrics"]
frame_metrics.head()
Annotate Events with Frame Metrics#
massphoto.events.annotate_frame_metrics() maps the per-frame metrics
from fitres.attrs["frame_metrics"] onto each detected event based on its
frame index:
fitres = mp.annotate_frame_metrics(fitres)
fitres[["frame", "x", "y", "masses_kDa", "intensity", "sharpness", "signal", "drift_speed"]].head()
Inspect Frame Properties Over Time#
We visualize how illumination intensity, sharpness, ratiometric noise floor (signal), and drift speed evolve across the acquisition. An upper threshold of \(\mu + 3\sigma\) on the ratiometric signal is marked as a dashed line to flag frames affected by transient noise or crowding spikes.
signal_limit = frame_metrics["signal"].mean() + 3 * frame_metrics["signal"].std()

fig, axes = plt.subplots(4, 1, figsize=(8, 8), sharex=True)

axes[0].plot(frame_metrics.index, frame_metrics["intensity"], color="tab:blue")
axes[0].set_ylabel("Intensity\n(counts)")
axes[0].grid(True, linestyle="--", alpha=0.4)

axes[1].plot(frame_metrics.index, frame_metrics["sharpness"], color="tab:orange")
axes[1].set_ylabel("Sharpness\n(rel. std)")
axes[1].grid(True, linestyle="--", alpha=0.4)

axes[2].plot(frame_metrics.index, frame_metrics["signal"], color="tab:green")
axes[2].axhline(signal_limit, color="black", linestyle="--", lw=1, label=r"Mean + 3$\sigma$")
axes[2].set_ylabel("Signal\n(ratiometric std)")
axes[2].legend(frameon=False, loc="upper right")
axes[2].grid(True, linestyle="--", alpha=0.4)

axes[3].plot(frame_metrics.index, frame_metrics["drift_speed"], color="tab:red")
axes[3].set_ylabel("Drift Speed\n(px/frame)")
axes[3].set_xlabel("Frame number")
axes[3].grid(True, linestyle="--", alpha=0.4)

plt.tight_layout()
plt.show()
Filter Events Using Frame Metrics#
Using the annotated signal column, we can exclude events recorded during
frames where the ratiometric signal exceeds \(3\sigma\) above the mean:
fitres_filtered = fitres[fitres["signal"] <= signal_limit]
print(f"Retained {len(fitres_filtered)} of {len(fitres)} events (signal <= {signal_limit:.5f})")
Retained 14445 of 14629 events (signal <= 0.00111)
Total running time of the script: (0 minutes 33.952 seconds)