Note
Go to the end to download the full example code.
Drift correction#
This example demonstrates how to correct for sample drift in a movie using
the massphoto.correct_drift() function.
This correction is automatically applied when using massphoto.fit() with the
movie_correct_drift=True argument, but here we show how to do it manually and
visualize the results.
import matplotlib.pyplot as plt
import numpy as np
Download example data#
This tutorial uses a short example movie from Zenodo. You can replace this block with a direct file path once you have a local file.
from zenodozipdownloader import ZenodoZipDownloader

import massphoto as mp

files = ZenodoZipDownloader(
    doi="10.5281/zenodo.15800729",
    download_dir="example_data",
).download(inner_pattern="005_mfp1_500x.mp")
if not files:
    raise RuntimeError(
        "Failed to download example data. Please download it manually from https://zenodo.org/record/15800729 "
        "or set path_movie to your own movie file."
    )
path_movie = files[0]

print(f"Using movie: {path_movie}")
Using movie: /home/runner/work/massphoto/massphoto/docs/source/_examples/example_data/005_mfp1_500x.mp
Determine and correct drift#
Load the movie and choose a template image used for alignment. A robust choice is the mean image over time (also the default template in correct_drift).
movie, metadata = mp.read_movie(path_movie, convert_metadata=True)
movie = movie.astype(float)

template = np.mean(movie, axis=0)

movie_corrected, drift = mp.correct_drift(movie, template=template, return_drift=True)
Plot drift over time#
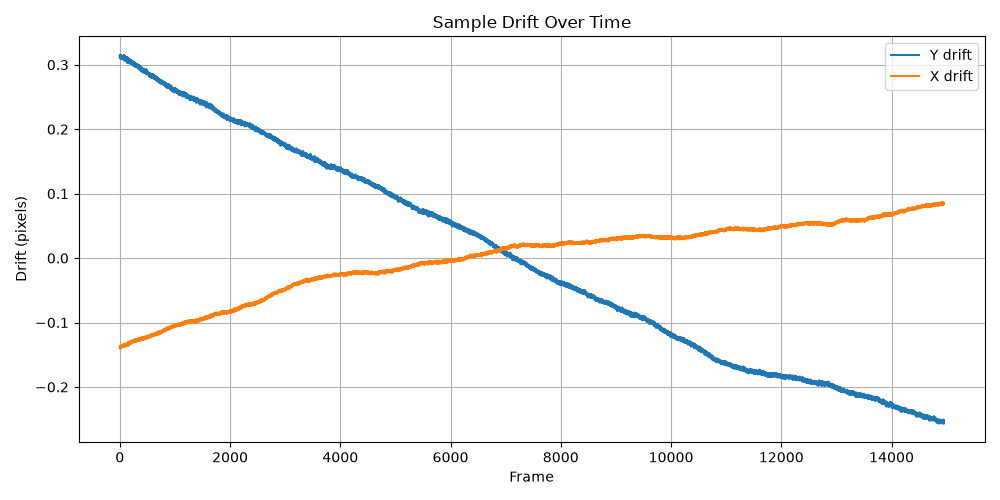
drift contains the per-frame translation (in pixels) applied to align each frame to the template.
plt.figure(figsize=(10, 5))
plt.plot(drift[:, 0], label="Y drift")
plt.plot(drift[:, 1], label="X drift")
plt.xlabel("Frame")
plt.ylabel("Drift (pixels)")
plt.legend()
plt.title("Sample Drift Over Time")
plt.grid(True)
plt.tight_layout()
Visual sanity check (before/after)#
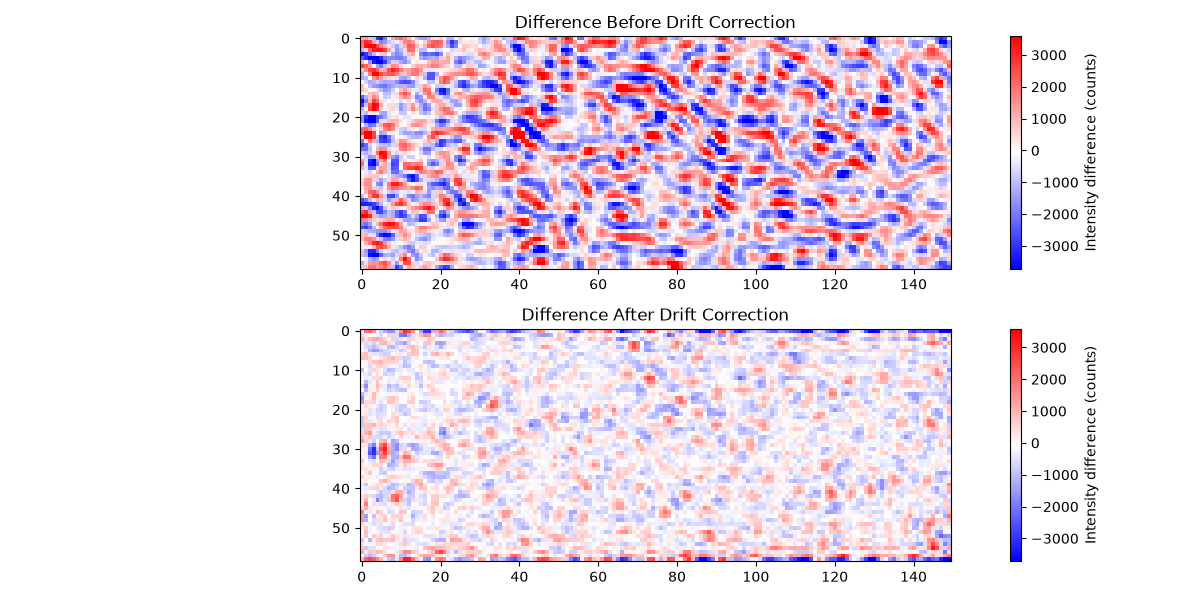
Compare the difference between the first and last frame. With drift, the difference image often shows edge-like structures; after correction, these should be reduced.
diff_before = movie[-1] - movie[0]
diff_after = movie_corrected[-1] - movie_corrected[0]

vmin, vmax = np.quantile(diff_before, [0.01, 0.99])
plt.figure(figsize=(12, 6))
plt.subplot(2, 1, 1)
plt.imshow(diff_before, cmap="bwr", vmin=vmin, vmax=vmax)
plt.title("Difference Before Drift Correction")
plt.colorbar(label="Intensity difference (counts)")
plt.subplot(2, 1, 2)
plt.imshow(diff_after, cmap="bwr", vmin=vmin, vmax=vmax)
plt.title("Difference After Drift Correction")
plt.colorbar(label="Intensity difference (counts)")
plt.tight_layout()
Total running time of the script: (0 minutes 12.895 seconds)